| Restaurant Consumer Market Review.pdf |
Sponsored Publication of
Park Cafe Food & Beverage
Author: Hoem Seiha
Restaurant Market Review
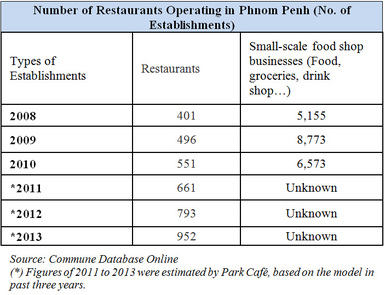
Restaurant consumer market in Phnom Penh has grown fast in recent years thanks to the rise of middle class and fast-changing lifestyles of the urban population. The exact number of restaurants and other types of eating establishments is unknown because many of them are informal and not available in any formal directories. However, according to National Institute of Statistics, the number of restaurants was 401 in 2008, and reached 496 in 2009. In 2013, the total number of restaurants reached 952 at the average growth rate of about 20% year over year (National Instiute of Statistics, 2014). These counts could be referred to the number of restaurant brands, since other sources indicate a larger number of restaurants operating throughout Phnom Penh. The other source, Yellow Pages Cambodia, listed a total of 1762 restaurants and other types of eating establishments in Phnom Penh and 2990 restaurants throughout Cambodia as of 2014. By 2015, Yellow Pages updated its directories, showing a list of 2180, including all types of restaurants and eating houses.
Park Cafe Food & Beverage
Author: Hoem Seiha
Restaurant Market Review
Restaurant consumer market in Phnom Penh has grown fast in recent years thanks to the rise of middle class and fast-changing lifestyles of the urban population. The exact number of restaurants and other types of eating establishments is unknown because many of them are informal and not available in any formal directories. However, according to National Institute of Statistics, the number of restaurants was 401 in 2008, and reached 496 in 2009. In 2013, the total number of restaurants reached 952 at the average growth rate of about 20% year over year (National Instiute of Statistics, 2014). These counts could be referred to the number of restaurant brands, since other sources indicate a larger number of restaurants operating throughout Phnom Penh. The other source, Yellow Pages Cambodia, listed a total of 1762 restaurants and other types of eating establishments in Phnom Penh and 2990 restaurants throughout Cambodia as of 2014. By 2015, Yellow Pages updated its directories, showing a list of 2180, including all types of restaurants and eating houses.
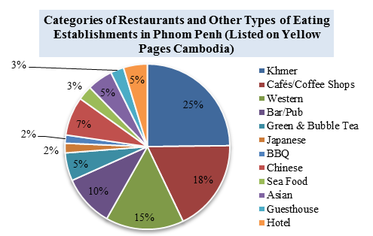
Based on the directories on Yellow Pages Cambodia (Restaurant Directories, 2015), there are 10 major restaurant categories, except two types of categories owned by guesthouses and hotels. The number of individual restaurant outlets, with different brands, listed in early 2015 was 2,180. The huge amount of increase of restaurants this year was due to the entry of AEON late last year, resulting in more than 70 eating establishments. The majority of restaurants were classified under the categories of Khmer food restaurants, with the number of 686 individual outlets, followed by that of cafés and coffee shops with the number of 501. The secondary market dominant category was Western-cuisine oriented restaurants, with the number of 422 individual restaurant outlets.
The rest of restaurants under other categories, when combined, counted about 1,150 individual restaurants.
Drivers of Restaurant Consumption
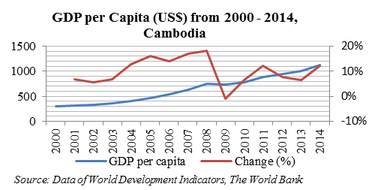
With difference diversity of the population, Phnom Penh boasts more than 2 million people, living and working there. With many more major drivers of restaurant market, the growing number of population could lead to an increase of restaurant consumptions. Emerging Middle Class Middle class population rises, as GDP per capita has been rising gradually, reaching US$1,130 (Xinhua Daily, 2014), compared to about US$783 in 2010 (The World Bank), while Cambodia was predicted by International Monetary Fund (IMF) to reach 7.2% of GDP growth rate in 2014 (Sophirom, 2014).The middle class population within urban areas, especially Phnom Penh has risen gradually. According to a recent study by Park Café, 13% of the professional population in Phnom Penh City earned more than US$600 to US$1,000 per month, and another 6% of the population earned more than US$1,000 to US$2,000 per month (Seiha, Restaurant Consumer Survey 2014, 2014).
The rest of restaurants under other categories, when combined, counted about 1,150 individual restaurants.
Drivers of Restaurant Consumption
With difference diversity of the population, Phnom Penh boasts more than 2 million people, living and working there. With many more major drivers of restaurant market, the growing number of population could lead to an increase of restaurant consumptions. Emerging Middle Class Middle class population rises, as GDP per capita has been rising gradually, reaching US$1,130 (Xinhua Daily, 2014), compared to about US$783 in 2010 (The World Bank), while Cambodia was predicted by International Monetary Fund (IMF) to reach 7.2% of GDP growth rate in 2014 (Sophirom, 2014).The middle class population within urban areas, especially Phnom Penh has risen gradually. According to a recent study by Park Café, 13% of the professional population in Phnom Penh City earned more than US$600 to US$1,000 per month, and another 6% of the population earned more than US$1,000 to US$2,000 per month (Seiha, Restaurant Consumer Survey 2014, 2014).
Improved Lifestyle
The improvement of lifestyle of the urban population plays a crucial role in the growth of consumer-based market such as ones in restaurant and retail sectors. The early starting of shopping malls such as Soriya Supermarket and Sovanna Shopping Mall has led to the change of consumer behavior. Today, there are many notable shopping complexes that not only offer retails but also are home to food and beverage establishments, to respond to the rapid change of consumer shopping and dining behavior.
Rise of Economic-Driven Population
Cambodian population aged between 15 and 30 comprises of 36%, and those with the ages between 15 and 54 comprise of 59% of the total Cambodian population in 2014 (Factbook, 2014). These age groups play an active role in economic drivers, and restaurant industry is one of the examples that have been driven by these age groups.
Trendy restaurants, such as fast food chains, cafés and trendy soft drink outlets, have been remarkably driven by young population between the ages of 15 and 30, as these groups, who prefer testing something new, are active and major consumers of restaurant and other consumer goods and services. With the increased influences of the Western and Eastern countries, young population has adopted foreign cultures so quickly, resulting in a change in shopping, consumptions, and dining behavior.
Growing Disposable Incomes
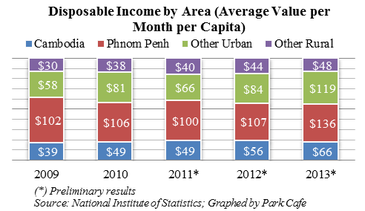
Despite a strong consumer purchasing power, the local disposable income is low if compared to the developed world.
The disposable incomes are those left after taxes and basic expenditure such as foods and basic needs and could be potentially spent for other goods and services out of necessity. For disposable income per capita per month, Phnom Penh’s population has the highest rate, reaching US$136 per month in 2013, while in the last 4 years it was US$102. With the indicated figure, the Capital has an estimate of US$200 million to US$300 million per month for lifestyle and several other consumer goods and services beside the basic ones.
Food Consumptions
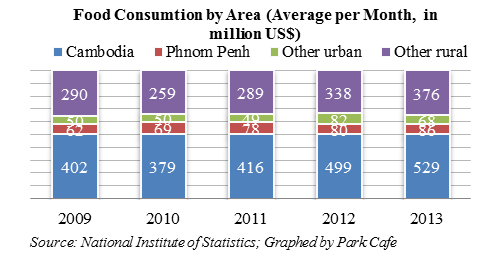
Consumptions of foods and related products are one of the highest expenses by the local population. Not only the expenses are on basic foods, but also are restaurant consumptions intended for lifestyle activities such as dining out in restaurants, shopping complexes, resorts and many other touristic areas.
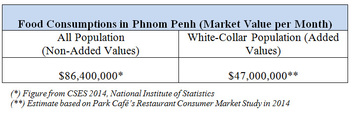
In Phnom Penh, average consumption of foods reached US$86 million per month (appr. US$1,030 million per year) in 2013, while the other urban areas as combined reached only US$68 million per month (appr. US$814 million per year) in the same year.
STUDY METHODOLOGY
The study of restaurant consumer market was conducted in the second quarter of 2014. The study took 991 sample subjects to examine the consumer behavior of dining and meal consumptions amongst white-collar population. The locations of the subjects for the study are within Phnom Penh, involving 15 communes throughout many districts of Phnom Penh.
Sampling of the Subjects
The selection of the samples was conducted using a combination of simple random and quota sampling techniques. The total sample size of the study is 991 respondents across different sectors to represent approximately 600,000 of white-collar workers in private and governmental sectors (National Institute of Statistics, 2013), with the confidence limit of 5% and expected frequency of 70%. Among the respondents taken in the study, the percentage of male subjects was 58%, while that of the female was 42%. Almost all the subjects chosen for the study were white-collar professionals.
Statistical Analysis Data collected from the survey was entered into statistical software Epi Info 7 and the analysis was made using its classic analysis module. Excel was used primarily for the design of graphs and diagrams.
Market Size of Typical Meals
It is hard to estimate the total value of restaurant consumer market among general population in Phnom Penh. However, the study could come up with a rough estimate of the market value (including added values such services and taxes) among white-collar population at US$1.56 million per day.
Consumptions of foods and related products are one of the highest expenses by the local population. Not only the expenses are on basic foods, but also are restaurant consumptions intended for lifestyle activities such as dining out in restaurants, shopping complexes, resorts and many other touristic areas.
In Phnom Penh, average consumption of foods reached US$86 million per month (appr. US$1,030 million per year) in 2013, while the other urban areas as combined reached only US$68 million per month (appr. US$814 million per year) in the same year.
STUDY METHODOLOGY
The study of restaurant consumer market was conducted in the second quarter of 2014. The study took 991 sample subjects to examine the consumer behavior of dining and meal consumptions amongst white-collar population. The locations of the subjects for the study are within Phnom Penh, involving 15 communes throughout many districts of Phnom Penh.
Sampling of the Subjects
The selection of the samples was conducted using a combination of simple random and quota sampling techniques. The total sample size of the study is 991 respondents across different sectors to represent approximately 600,000 of white-collar workers in private and governmental sectors (National Institute of Statistics, 2013), with the confidence limit of 5% and expected frequency of 70%. Among the respondents taken in the study, the percentage of male subjects was 58%, while that of the female was 42%. Almost all the subjects chosen for the study were white-collar professionals.
Statistical Analysis Data collected from the survey was entered into statistical software Epi Info 7 and the analysis was made using its classic analysis module. Excel was used primarily for the design of graphs and diagrams.
Market Size of Typical Meals
It is hard to estimate the total value of restaurant consumer market among general population in Phnom Penh. However, the study could come up with a rough estimate of the market value (including added values such services and taxes) among white-collar population at US$1.56 million per day.
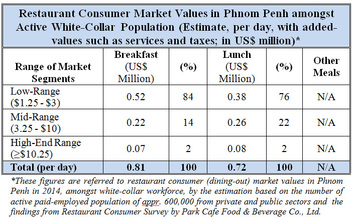
Breakfast Meals
An estimated value of breakfast meals (with added values) was US$0.81 million each day, and share of market value of low-range segment accounted for 84% of the white-collar population, with a value of US$0.52 million. While mid-range segment accounted for 14% with a value of US$0.22 million, the high-end range accounted for only 2% with an estimated value of US$0.07 million.
An estimated value of breakfast meals (with added values) was US$0.81 million each day, and share of market value of low-range segment accounted for 84% of the white-collar population, with a value of US$0.52 million. While mid-range segment accounted for 14% with a value of US$0.22 million, the high-end range accounted for only 2% with an estimated value of US$0.07 million.
Lunch Meals
The similar estimate of the market value for lunch meals (with added values) was US$0.72 million per day. The market share of low-range segment for lunch meals accounted for 76%, with an estimated value of US$0.38 million. While mid-range segment accounted for 22% with an estimated value of US$0.26 million, the high-end range accounted for only 2% with an estimated value of US$0.08 million.
Food-Cost Rates in Restaurant Industry
Total food consumptions in Phnom Penh in 2013 were recorded at US$1,028 million per year (National Instiute of Statistics, 2014), and those were non-value added at restaurant level.
With the growing restaurant industry, packaging and other services add more values to foods served in restaurants and other related establishments. However, not all food products being consumed by the population are added with values at restaurant and other related establishment levels, and therefore it is hard estimate the overall values added to overall food consumptions.
Nonetheless, according to a range of restaurant industry rate, values added to meals served in average restaurants and other types of eating establishments are as low as 60% and as high as 65% (Buckley). Food costs are usually between 25% and 38%, while other costs such labor are usually between 25% and 35%.
Therefore, values added to the industry range from 60% to 65%. With the assumption that total market size for restaurant industry among white-collar consumers is US$564 million per year, values added to the industry annually is estimated roughly at US$338 million.
Conclusion
Restaurant industry has considerably grown in recent years, reaching roughly 2,180 individual restaurants and other similar establishments (Restaurant Directories, 2015). The huge amount of increase this year was due to the entry of AEON Mall late last year, bringing in more than 70 eating establishments.
Demand on High-Standard Dining
Although restaurant market environment is so competitive now, with the rising demand of the middle class for high quality meals and services, there are some opportunities that seems beneficial to restaurateurs who look to take another step to improve their offered food products by raising the quality of services, food safety and hygiene.
With the rising demand on well-established restaurants and similar establishments offering fashionable dining settings, especially among young active population between 15 and 30 years of age accounting for 36% of Cambodian population (Factbook, 2014), there is a good potential for mid-to-high-end restaurants that aim to attract the emerging middle class who prefer something new and fashionable.
In the meantime, with a good amount of expense for daily consumptions of restaurant products, being estimated at US$1.53 million among white-collar workforce, mid-range restaurants are seen potential to attract an estimate of US$0.48 million for morning- noon serving time, according to the study findings.
Trendy Dining
Trendy restaurants, especially cafés and coffee-related establishments have seen potential to attract trendy population who prefers to meet their friends or colleagues during meals (beside breakfast or lunch time), as this accounts for 58% of the total visits, followed by 52% who does this for business discussions during their meals.
For this reason, restaurateurs should look into room for the improvement of the environment setting aiming to attract trendy visitors.
Bibliography Restaurant Directories. (2015). Retrieved March 21, 2015, from Yellow Pages Cambodia: http://yp.com.kh/search/?q=restaurants&location=01834EE1-FA95-48DE-831A-3D3C05DD3AFC&category=C977D970-FB96-11E0-837C-12314000E861
Buckley, S. (n.d.). Common Food & Labor Cost Percentages. Retrieved March 21 , 2015, from Small Business Chron: http://smallbusiness.chron.com/common-food-labor-cost-percentages-14700.html
Factbook, W. (2014, April 11). East&Southest Asia: Cambodia. Retrieved April 21, 2014, from Central Intelligence Agency: www.cia.gov/library/publications/the-world-factbook/geos/cb.html
National Institute of Statistics. (2013). Cambodia Inter-Censal Population Survey (CIPS 2013). Phnom Penh: National Institute of Statistics.
National Instiute of Statistics. (2014). Cambodia Socio-Economic Survey CSES 2014. Phnom Penh: National Instiute of Statistics.
Numbeo. (2015, February). Cost of Living in Cambodia, Prices in Cambodia. Retrieved February 22, 2015, from Numbeo: http://www.numbeo.com/cost-of-living/country_result.jsp?country=Cambodia
Seiha, H. (2014). Restaurant Consumer Survey 2014. Phnom Penh: Park Cafe.
Seiha, H. (2014). Restaurant Consumer Survey 2014. Phnom Penh: Park Café.
Sophirom, K. (2014, February 4). IMF: Cambodia’s GDP Growth To Reach 7.2% This Year. Retrieved December 1, 2014, from Phnom Penh Post: http://www.akp.gov.kh/?p=41613
The World Bank. (n.d.). The World Bank. Retrieved March 14, 2015, from Data: GDP per capita (current US$): http://data.worldbank.org/indicator/NY.GDP.PCAP.CD
Xinhua Daily. (2014, August 19). Cambodia's GDP per capita to hit 1,130 USD in 2014: PM. Retrieved December 1, 2014, from The Cambodia Herald: http://www.thecambodiaherald.com/cambodia/cambodias-gdp-per-capita-to-hit-1130-usd-in-2014:-pm-7168
A Publication of

Disclaimer
Park Café Food & Beverage Co. Ltd. would like to inform that the information, including figures, statistics and opinions, is that expressed by the author of this publication and does not reflect Park Café’s points of view. Therefore, Park Café Food & Beverage does not guarantee or bear any responsibility for any failures pertaining to the information contained herein.
For Full Report
Please contact the following:
Author
Hoem Seiha
Email: [email protected]
H/p: +855-12-699-553
Park Café Food & Beverage
3rd Floor #113(Parkway Square) Mao Tse Toung Blvd, Phnom Penh, Cambodia.
Tel: +855-12-232-823
Email: [email protected]
Website: http://www.myparkcafe.com